Journeys Dashboard
Once you’ve implemented Devvit Journeys, you’ll be able to see how users are engaging with your app. You’ll find Journeys analytics on the App Details page, under the Analytics tab.
Journey metrics are displayed in a dedicated section below the existing engagement metrics.
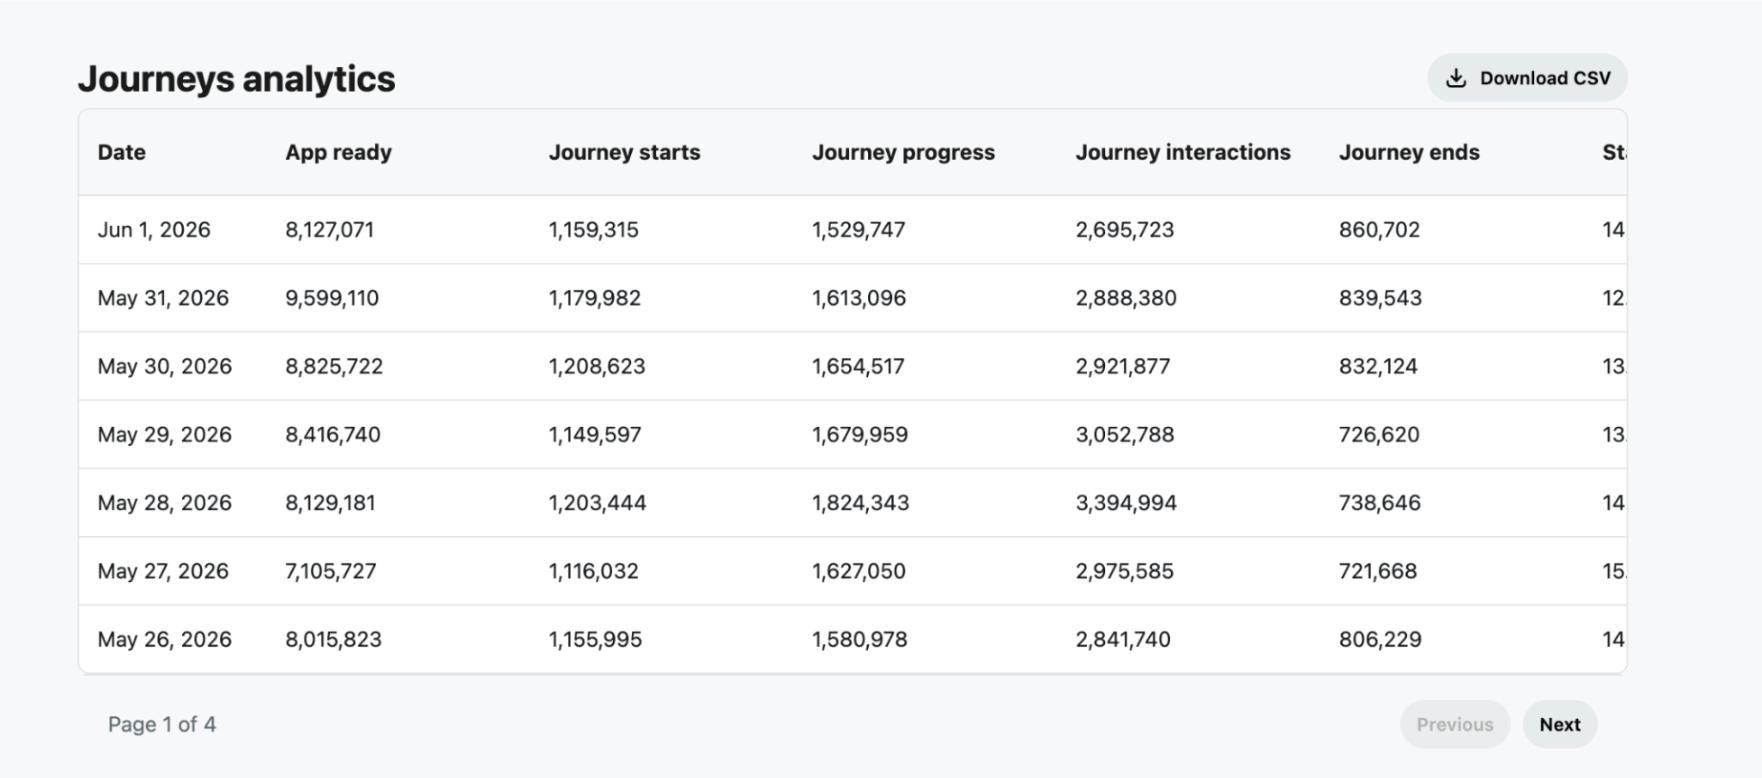
Understanding your data
Journey analytics data is aggregated into a single record per app per UTC day. This data helps you understand the user’s experience of your app. At a high level:
- Start Rate: Are users engaging with my app?
- Completion Rate: Are users successfully finishing the game?
- Sessions per User: Are users coming back?
- Median Session Duration: How much time are users spending in my app?
- Journey Progress & Interaction Events: Where are users engaging or getting stuck?
Journeys insights
Raw event counts show overall Journey activity and usage volume.
Rate- and duration-based metrics help developers evaluate Journey adoption, engagement, and completion, making it easier to identify trends and diagnose issues.
| Metric | What it tells you |
|---|---|
| utc_day | Lets you analyze app performance over time and identify trends, regressions, or the impact of releases. |
| app_ready_count | Shows how often the app was successfully loaded and available to users. Serves as the baseline for measuring adoption. |
| journey_start_count | Indicates how many times users began your game. Helps measure interest and discoverability of your app’s entry points. |
| journey_progress_count | Reveals how actively users move through your app. Sudden drops may indicate friction or confusing steps. |
| journey_interaction_count | Measures user engagement within your app. Helps identify whether users are actively interacting or passively abandoning flows. |
| journey_end_count | Shows how many users reached an end state. Useful for understanding overall throughput and completion volume of your game. |
| start_rate | Measures the percentage of app loads that result in a user starting the game. Helps evaluate whether users are discovering and choosing to engage with your app. |
| completion_rate | Measures the percentage of times a user has started your game and successfully reached completion. Helps identify drop-off problems and assess the effectiveness of your app’s design. |
| sessions_per_day | Shows how frequently users engage with your app on average. Helps distinguish between occasional use and repeat engagement. |
| median_session_duration_seconds | Indicates how long users typically spend in your app. Helps assess game complexity, engagement depth, and the impact of changes to the game flow. |
You can download a CSV of your daily Journey metrics over a 30-day lookback period.